IDMM Market Structure Heat Map
S&P 500
Structural Breadth Summary
This session showed measurable structural participation across the selected universe. The objective is not predicting every market move. The objective is measuring how participation and structural behavior evolve throughout the session.
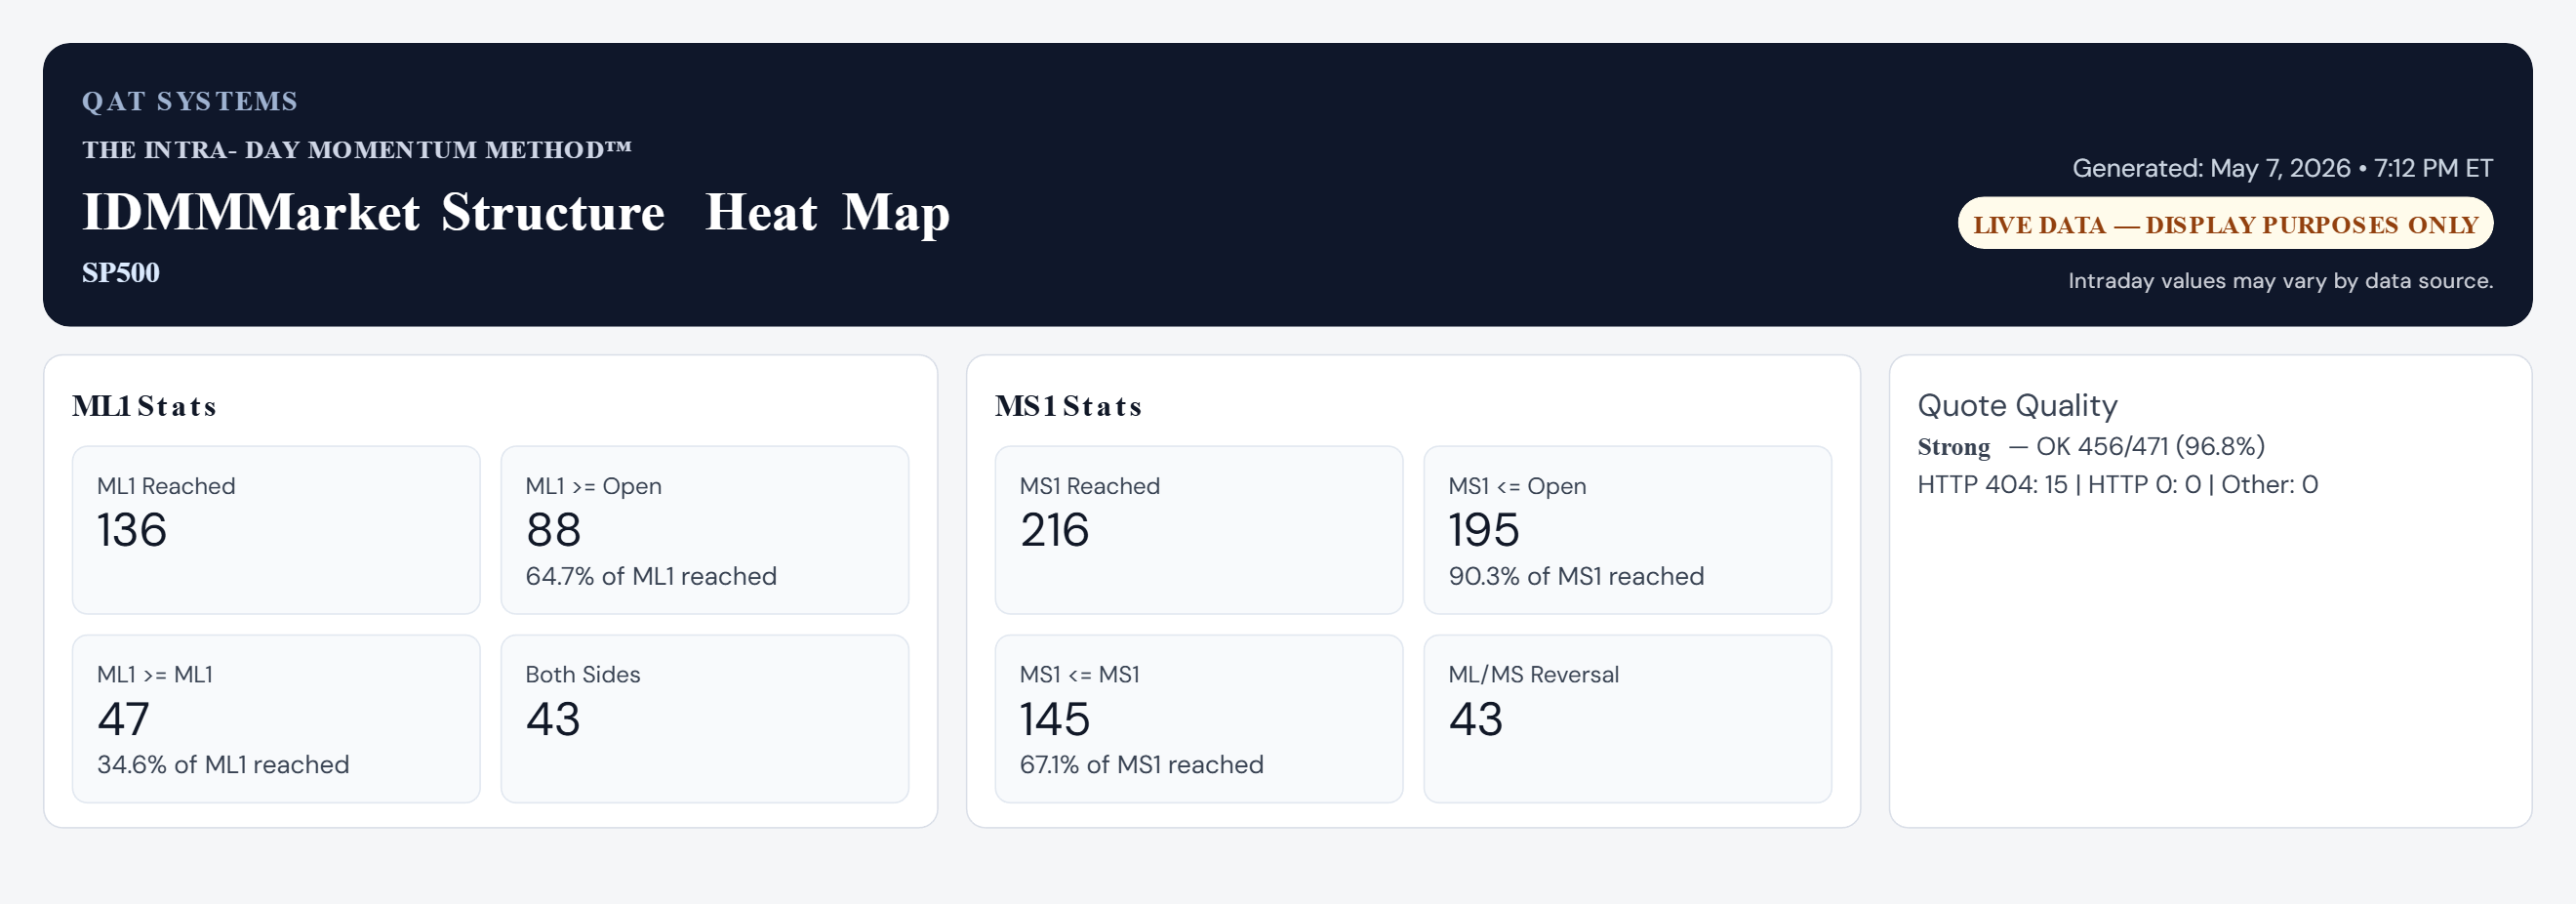
Statistics Snapshot
A compact summary of the session's IDMM structural statistics.
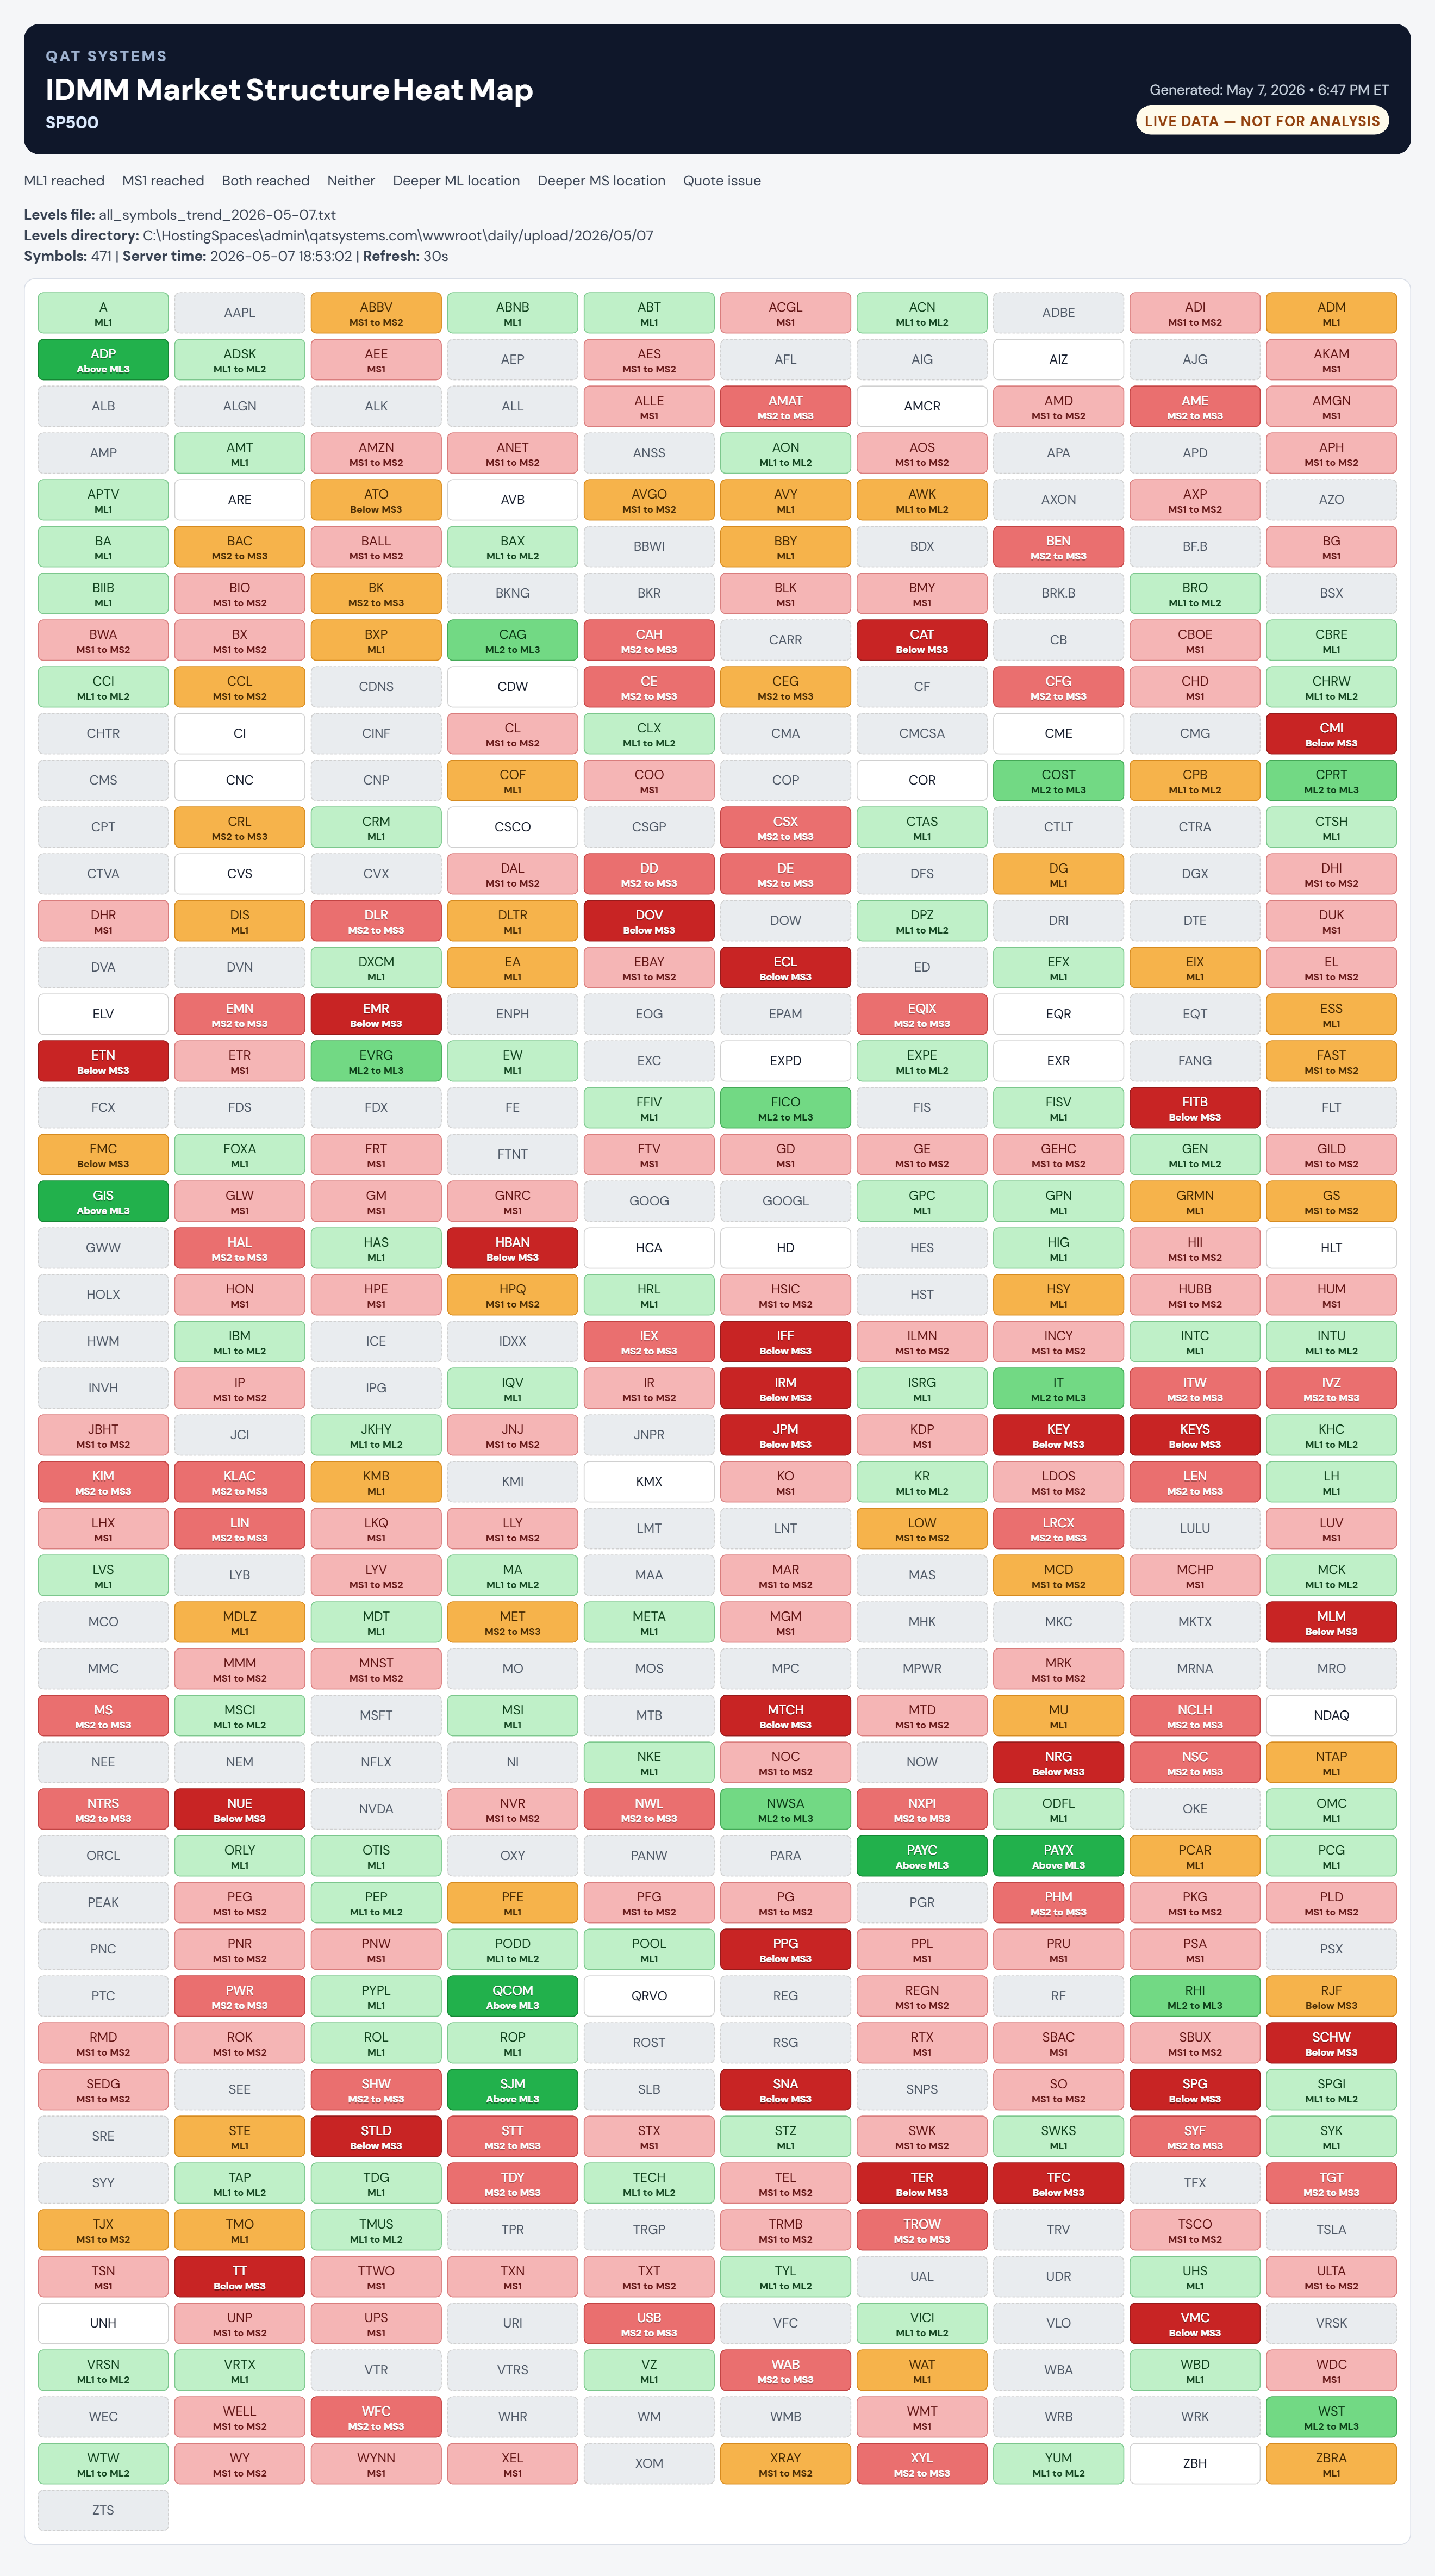
Market Structure Heat Map
A broader view of structural participation across the selected universe.
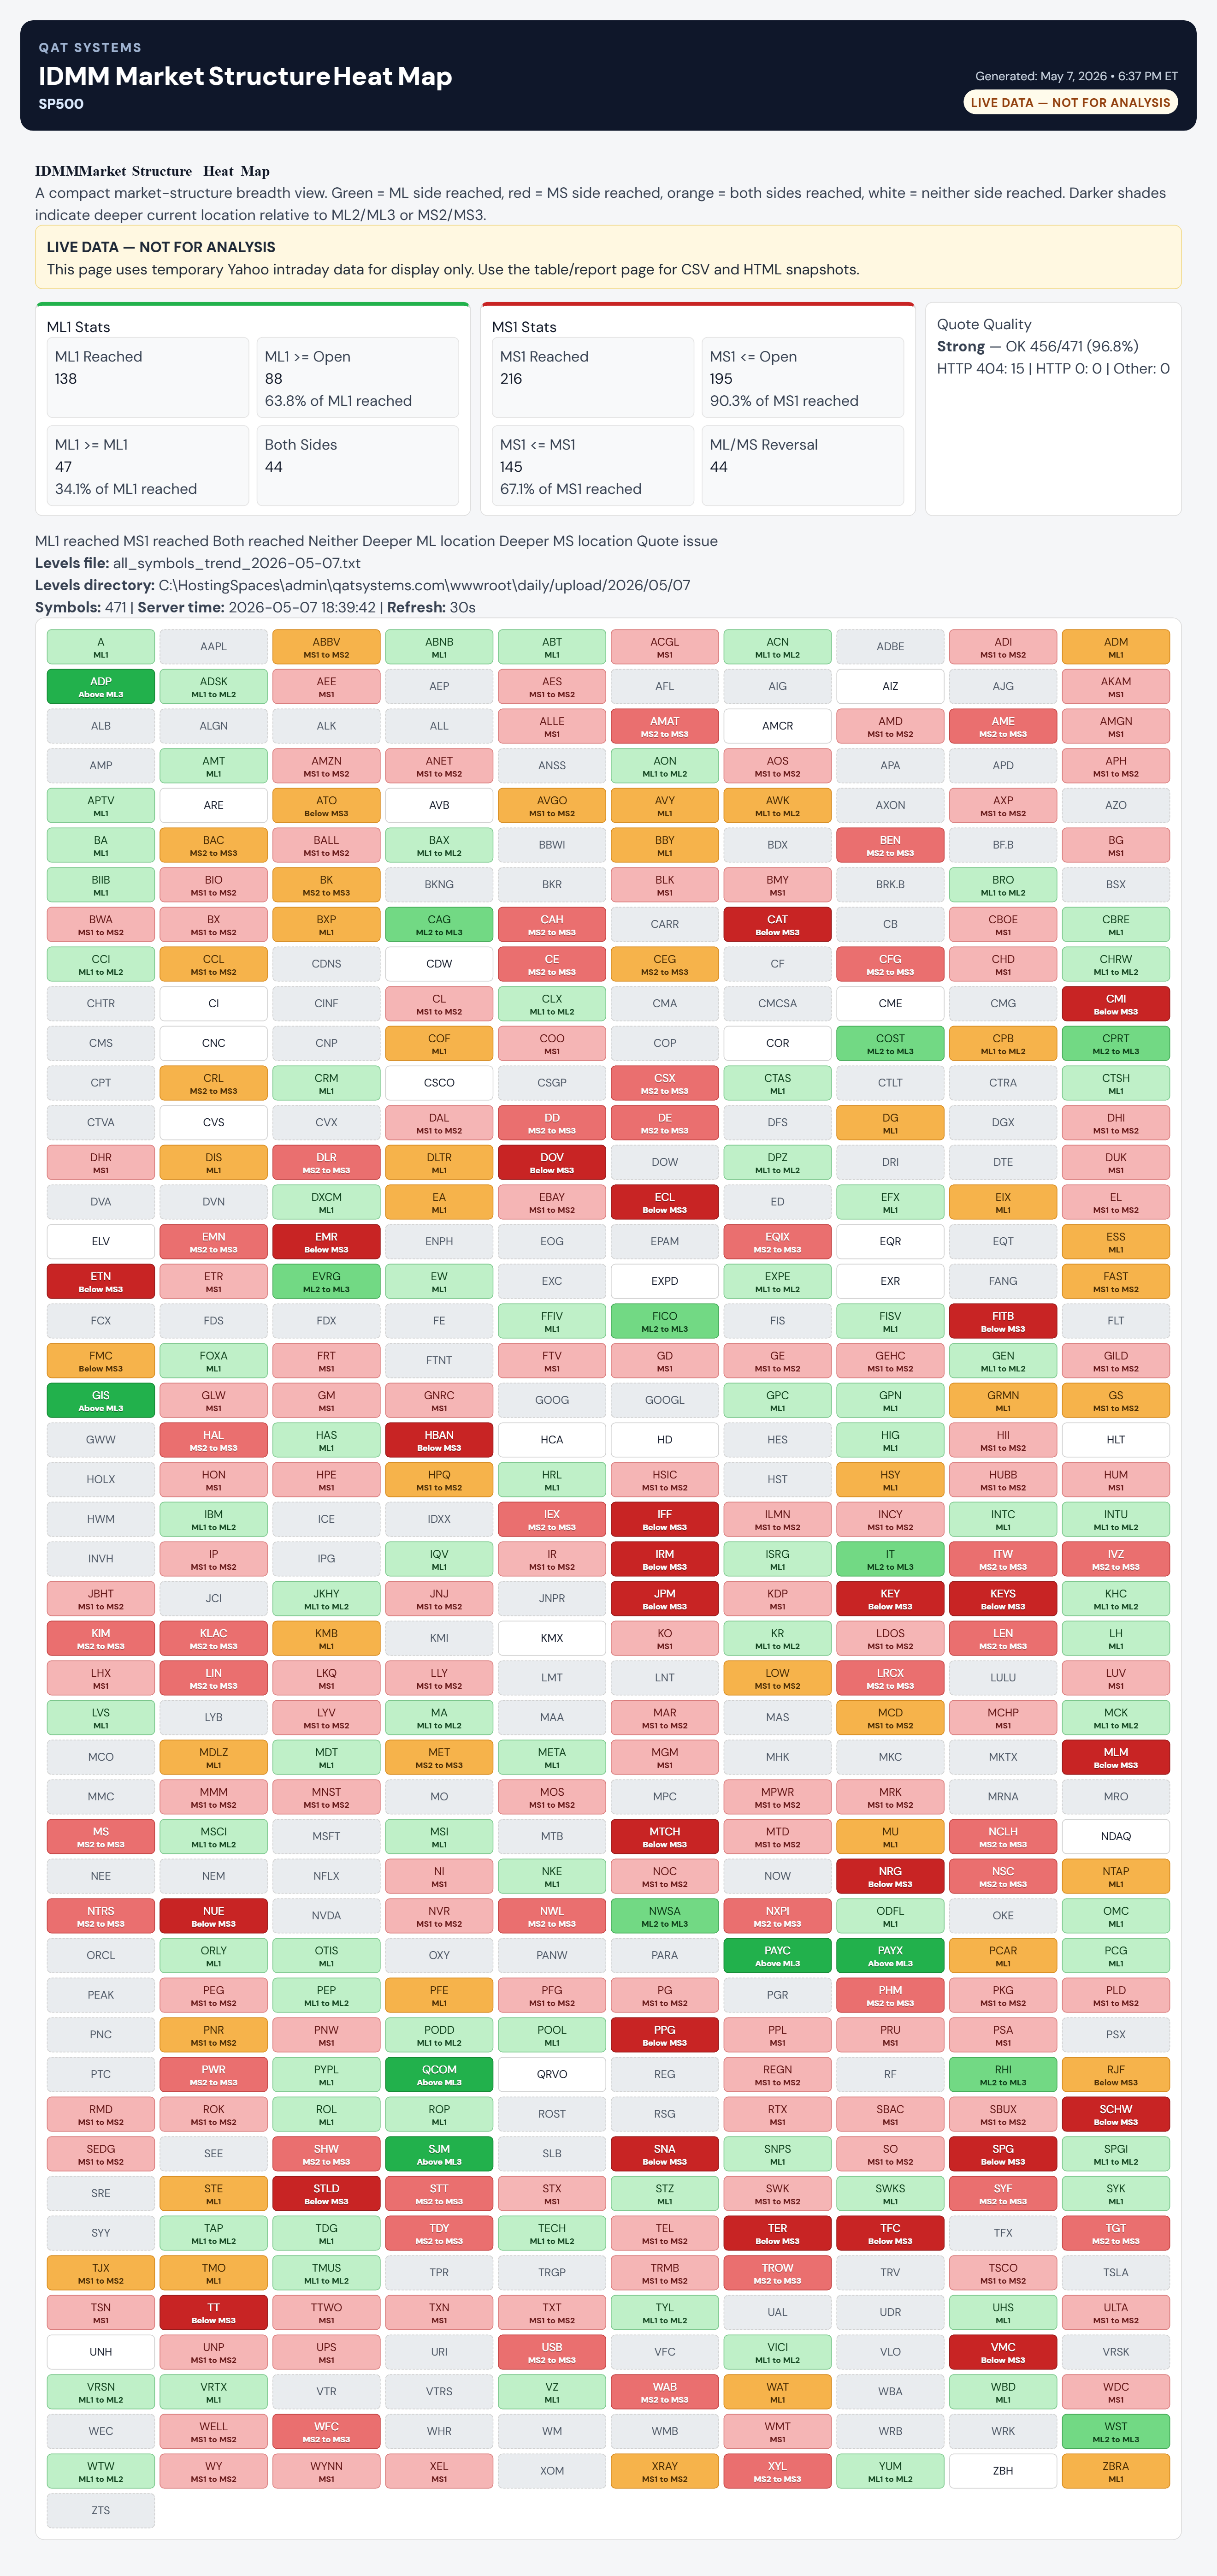
Full Dashboard
Combined structural statistics and heat map view.
Data Source Note
These statistics are derived from specific market data sources and processing methodologies and should be viewed as research observations rather than absolute values. Results may vary depending on data provider differences, session definitions, opening values, quote quality, and intraday data construction. The objective is transparency and continual refinement using the best data currently available.