Articles
Determining Daily Intra-Day Direction - Is it Possible?
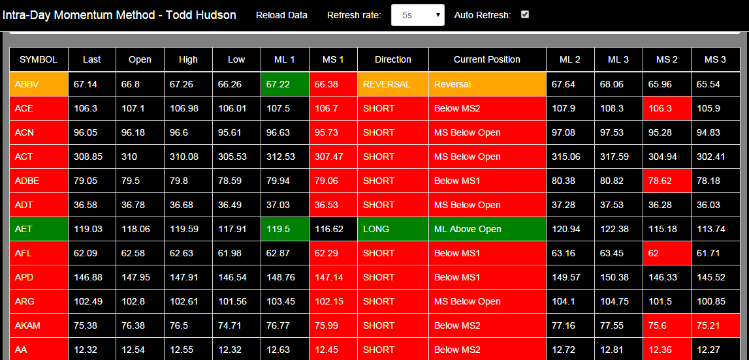
Successful speculation starts with observation. Instead of looking at charts, I have designed a methodology for determining intra-day direction based on 'measured moves' and created applications to answer my questions regarding trade-able tendencies and to assist in my research.
PDF Version
Determining Daily Intra-Day Direction -
- Is it Possible?
- Does Trend-Following Give a Trader an Edge?
An updated paper that includes the probabilities of extended levels being reached and ways to prove that trading in the direction of a trend would likely increase a trader's edge.
Does Trend Following Give a Trader an EDGE?
A question that has been left unanswered for centuries. Does trend-following give a trader an edge?
Is a solution out there? How do we answer this question? In order to find an answer, I chose to use The Intra-Day Momentum Method Levels as a starting point for the solution. The goal was not to specifically define a trend but to demonstrate mathematical solutions.
Determining Daily High/Low with The Intra-Day Momentum Method
The Intra-Day Momentum Method Levels are designed to determine the daily intra-day market direction. The results shown here are presented to demonstrate the model. When applied to over 400 stocks in the S & P 500 from April 2015 through October 2020, we see the following results. The graph below shows the High and Low of the day in relation to The Intra-Day Momentum Levels for this period of time. It demonstrates that the market has a specific price range in which it is most likely to trade.