Historical Results
The Intra-day Momentum Method was designed to help determine the best way to trade a particular stock / ETF, whether it is trend-following or reversion to the mean, in connection with a low-to-mid frequency intra-day trade. In order to determine which method had worked best over time, I created an algorithm that would find a measurement in price from the Open where the Close of the day had historically been above this level for Longs or below this level for Shorts approximately 50% of the time, for many stocks. *The ability of a stock to move plays an enormous role in this calculation. The ability to move is based on Price / Pattern / Volume. Stocks that do not move, will not likely close above / below the levels 50% of the time. While this is by no means perfect, it certainly gives a trader a method for selecting stocks and entry points that have a reasonable chance for success. The Method was developed to adapt to market changes rather quickly as it takes into account price-action, patterns, and volume. On the link below, you will find the results from 3-19-15 to the last update from a list of approximately 460 stocks from the S & P 500.
| SP 500 | ||
|---|---|---|
| Current Stats 4-1-15 to 10-09-2020 | ||
| *(Fed Meetings / Announcement Dates may not always included due to volatility) | ||
| 102314 | Close >= ML 1 | 50 % |
| 167938 | Close >= Open | 81 % |
| 206598 | Total ML 1 | |
| 208621 | Total MS 1 | |
| 164694 | Close <= Open | 79 % |
| 98833 | Close <= MS1 | 47 % |
| 51740 | ML 1 Reversals | 25 % |
| 51740 | MS 1 Reversals | 25 % |
| Total Reversals | 14 % | |
| These numbers are calculated EOD | ||
Historical Results - Calendar UNDER CONSTRUCTION
Results available upon request - We are currently building an application to acccess the data.
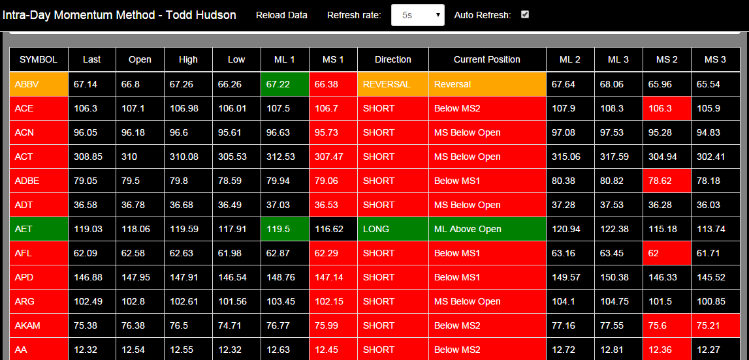
Real-Time Signals
View the Intra-Day Momentum Method in Real-Time, using a Proprietary web-based application that signals when stocks have crossed the levels.
Automated Stat Recording
Custom Programming Empowers the Researcher / Trader to design / develop intra-day approaches on their own.